

Most gut health testing these days is merely a snapshot. A product goes into a fermentation vessel, the microbiota gets a few hours or a few days to respond, the readout gets taken, and a decision gets made. Fast and affordable, and for some research questions it is entirely appropriate.
Unfortunately, to be effective a supplement is hardly ever taken once. It is taken every day, for weeks or months on end. And our gut microbial community is an ecosystem, which adapts on its own timescale, not on that of a study design. Which raises the uncomfortable question for anyone in gut health research: what does our quick test miss?
In a recently published study, we were able to obtain a clean answer, because the effect we were looking for did not exist in week one, or week two. It appeared in week three.
What we tested
Butyrate is one of the most important microbial metabolites in the human colon. It is the primary energy source for colonocytes, which are closely tied to barrier function and immune regulation. However, when butyrate is taken orally it is largely absorbed in the small intestine, so little of it reaches the colon where it matters most.
Enter our test compound: tributyrin, a butyrate precursor. Tributyrin resists gastric acid and is cleaved by pancreatic lipases, releasing butyrate further down the tract. As a postbiotic preparation, it can deliver butyrate where a compromised microbiome may no longer be producing enough on its own.
In an upper GI tract simulation under fasted conditions, we tracked a capsule and a softgel formulation through gastric and small intestinal transit. Roughly 41% (capsule) and 49% (softgel) of the dose was hydrolyzed to butyrate in the small intestine. The remaining 59% (capsule) and 51% (softgel) stayed intact and entered the colon.
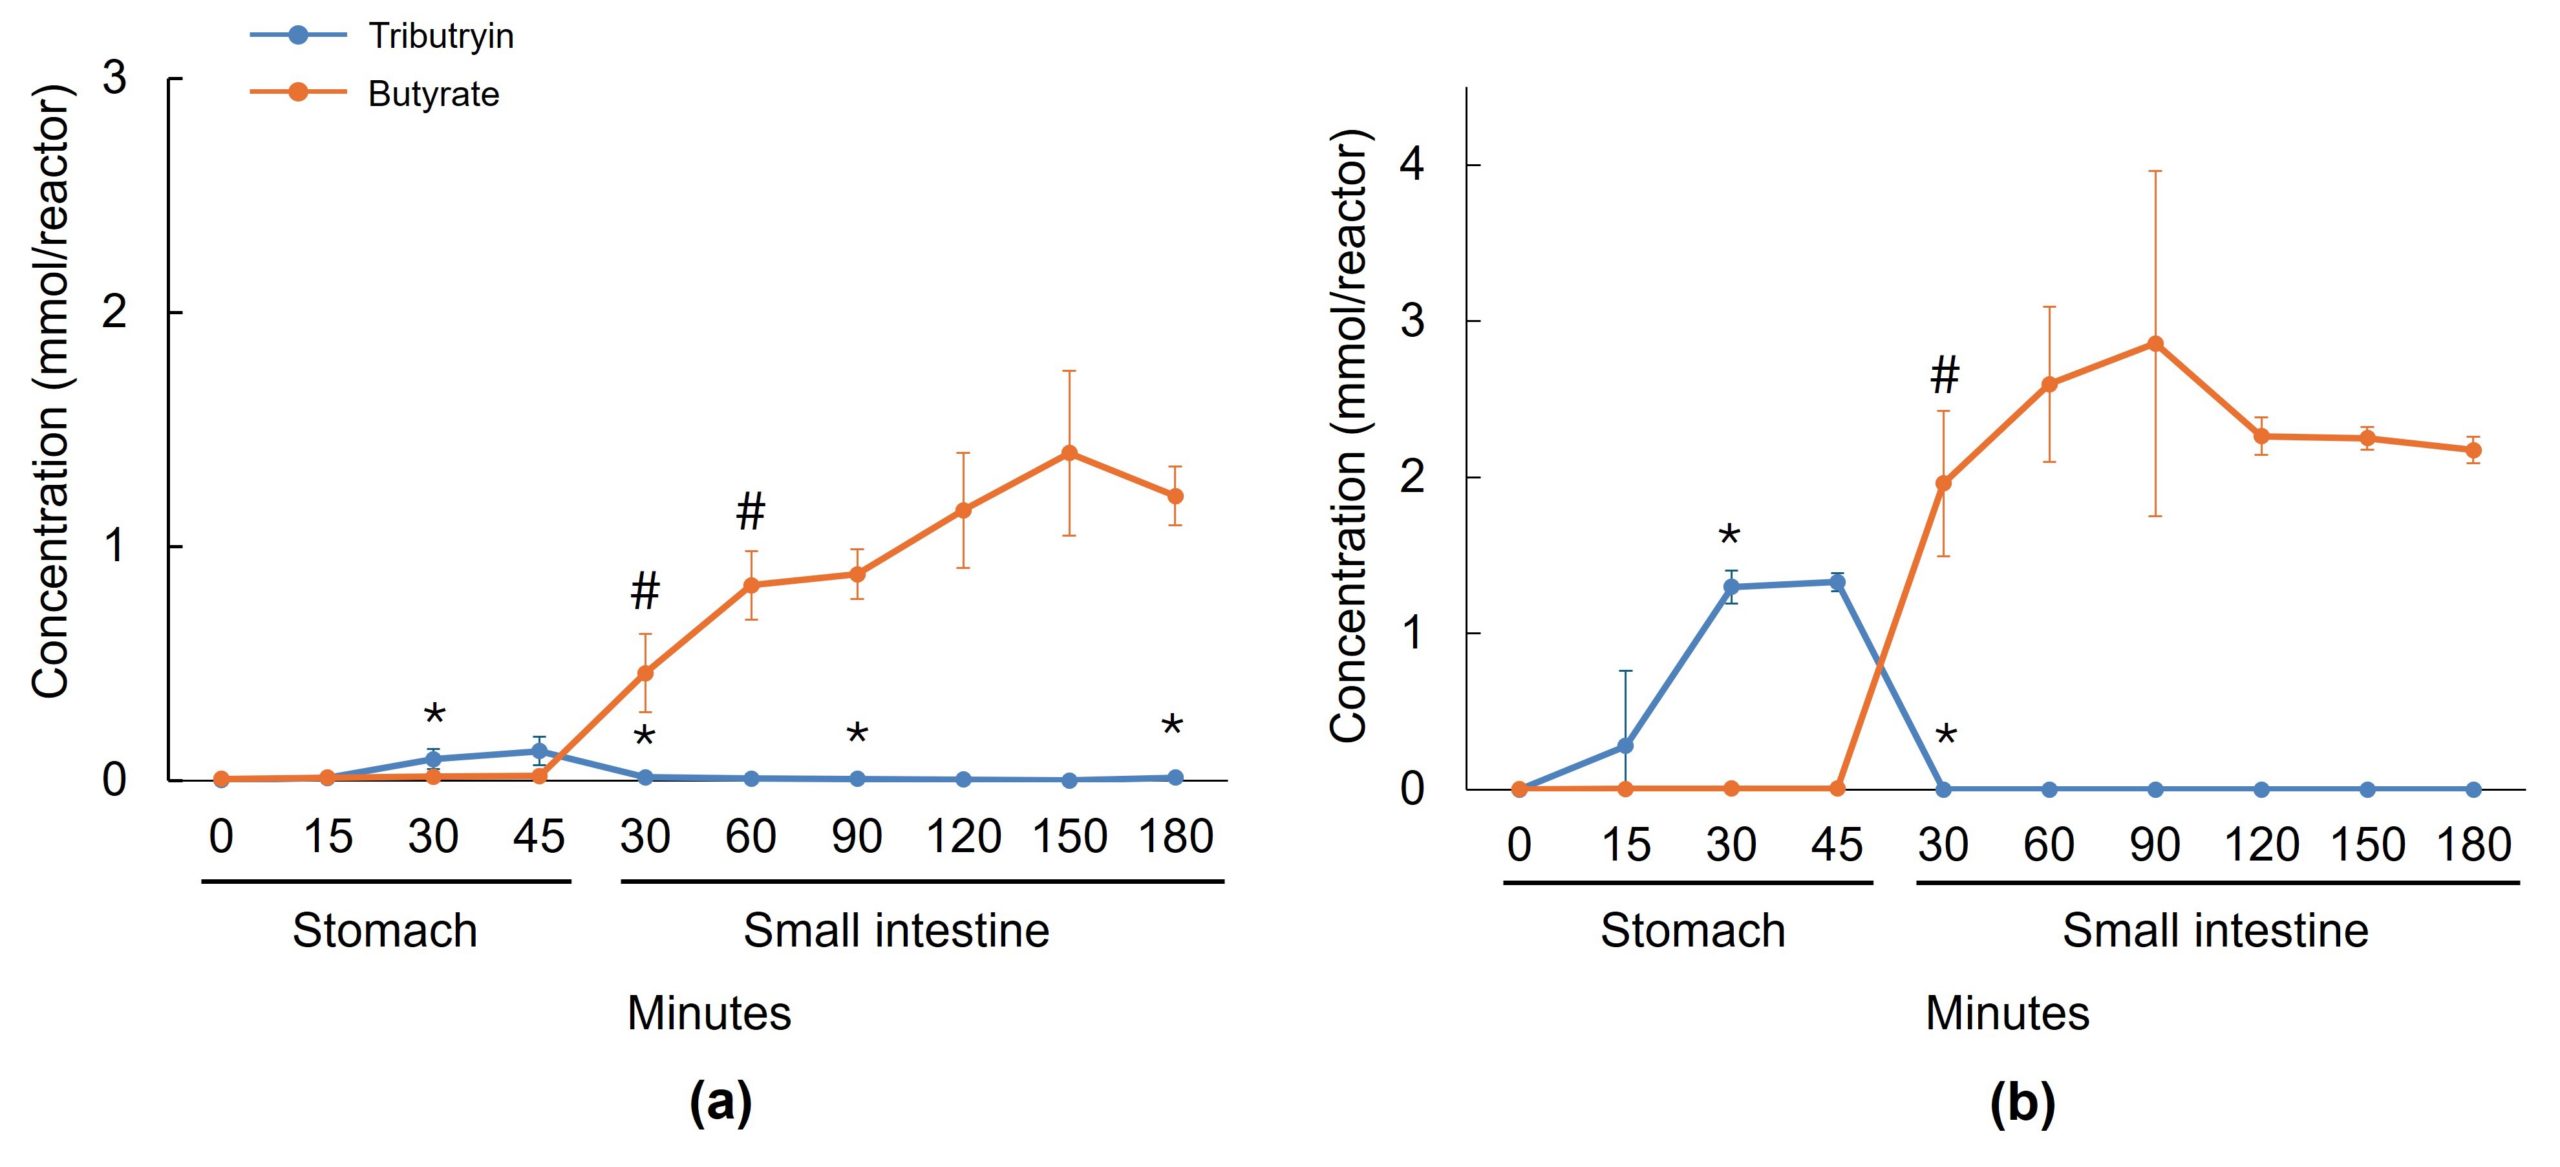
Line graphs visualizing the average concentration of tributyrin and butyrate during passage through the upper GIT under fasted conditions for the capsule (A) and softgel (B) formulations of tributyrin. Administered concentrations of tributyrin were 300 mg and 450 mg for the capsule and softgel formulation, respectively. Data are plotted as mean ± standard deviation (n = 3). *p < 0.05 versus the preceding timepoint for tributyrin measurements. #p < 0.05 versus the preceding timepoint for butyrate measurements. p-values were determined using a two-tailed homoscedastic Student’s t-test. GIT, gastrointestinal tract; SI, small intestine; ST, stomach.
Based on these numbers we simulated expected tributyrin doses in a long-term SHIME® setup, running the microbiota of three healthy donors in parallel. Each community was stabilized for two weeks to establish a baseline, followed by daily dosing for three consecutive weeks. Metabolic fingerprints were taken weekly. Short-chain fatty acids (SCFAs), branched-chain fatty acids (BCFAs) and ammonium were tracked throughout. Metagenomics and host-cell assays closed the loop at the end.
Our finding: timing and location is everything
Butyrate itself responded, clearly and in every donor, in both the proximal and distal colon. No surprise there, since one molecule of tributyrin yields three of butyrate, and the observed increase tracks the chemistry.
However, the more interesting part was what the wider metabolome did. Using untargeted metabolic fingerprinting across more than 1,600 detected features, we compared each treatment week against the control period. In the distal colon, week one showed no significant separation. Week two showed no significant separation. But week three showed a statistically validated shift in the overall metabolic profile that was not detectable earlier.
A second interesting finding: the same time-dependent metabolic shift did not reach significance in the proximal colon at any point in the study. In other words, where we looked mattered as much as when.
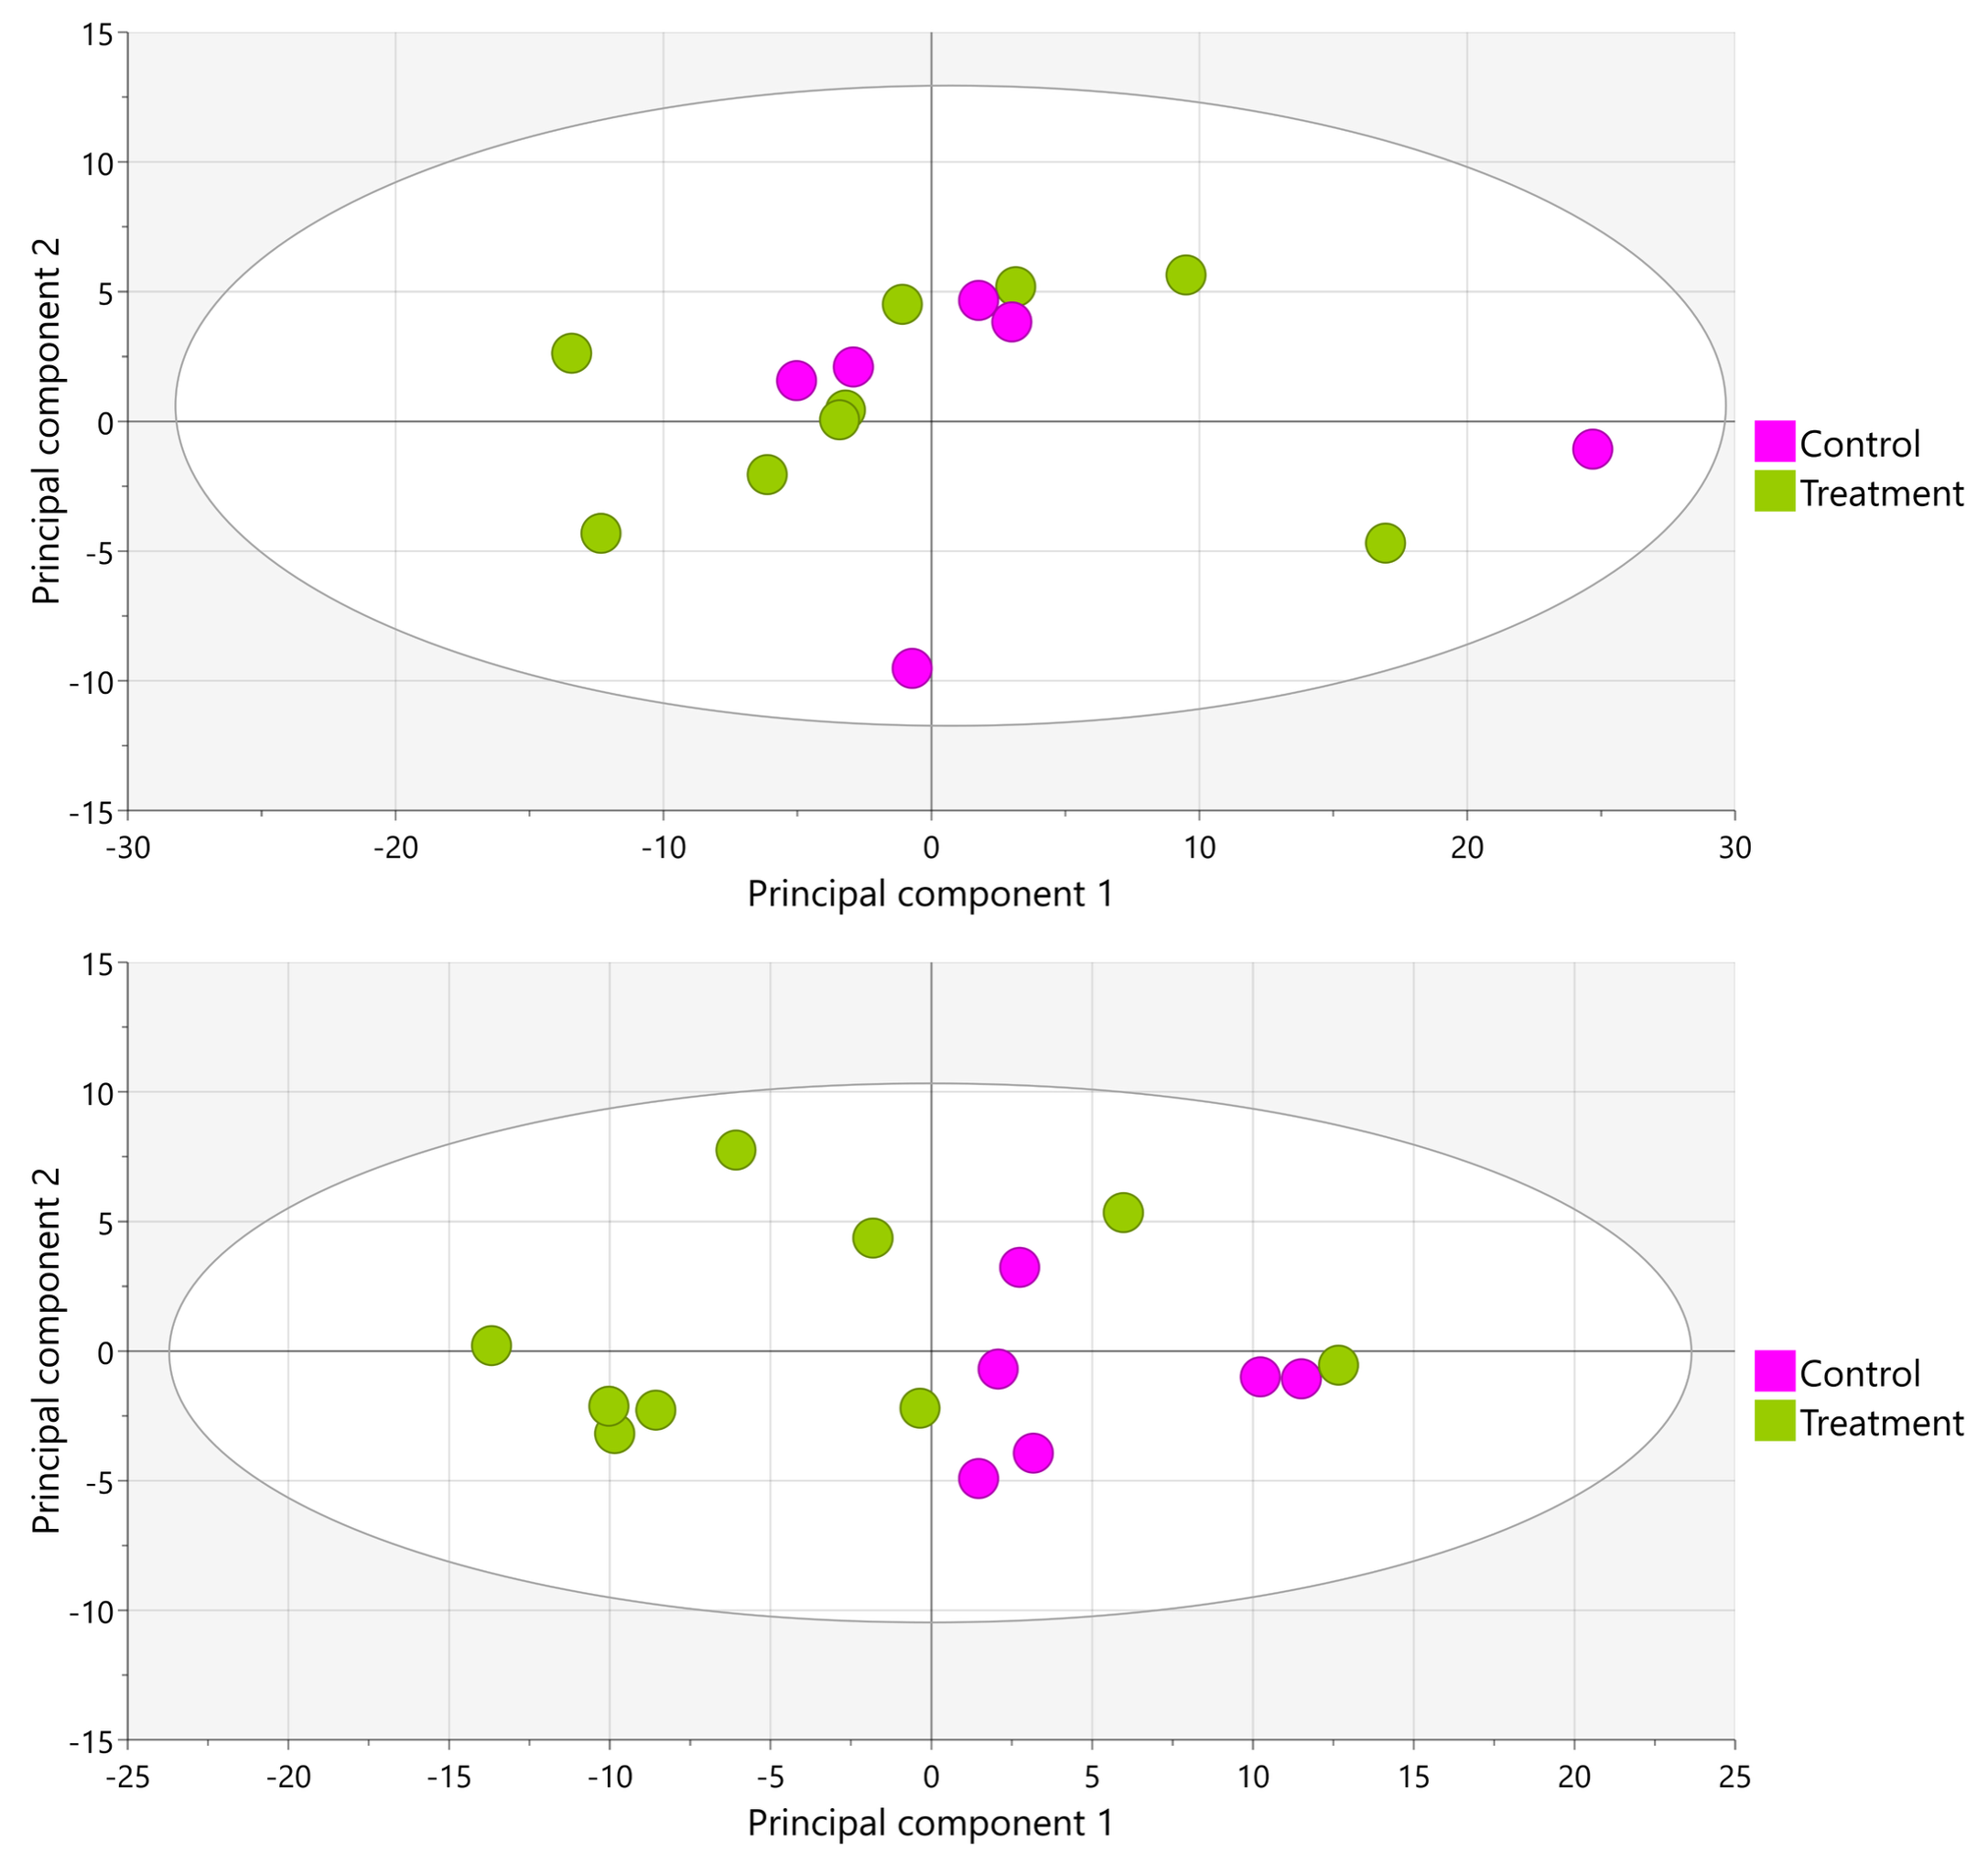
PCA-X score plots based on LA-REIMS data (negative ionization mode) obtained using biological samples (n = 15) from the proximal colon (top) and distal colon (bottom) during the Triple-L-SHIME® experiment. No test products were administered to the colon reactors during the control period, tributyrin was administered daily to the colon reactors during the three-week treatment period. Samples were collected from the indicated colon reactor during the control period (n = 6), TR1 (n = 3), TR2 (n = 3), and TR3 (n = 3) and subjected to LA-REIMS. LA-REIMS, Laser-Assisted Rapid Evaporative Ionization Mass Spectrometry; PCA-X, unsupervised principal component analysis; SHIME®, Simulator of the Human Intestinal Microbial Environment; TR1, treatment week 1; TR2, treatment week 2; TR3, treatment week 3.
What changed in the community, and at the gut wall
By the end of the treatment period, community composition had shifted in all three donors, most strongly in the proximal colon. Several primary degraders were enriched (including Bifidobacterium longum, Bacteroides fragilis and Alistipes species) alongside butyrate producers. In the distal colon, Akkermansia muciniphila was strongly enriched in two of the three donors.
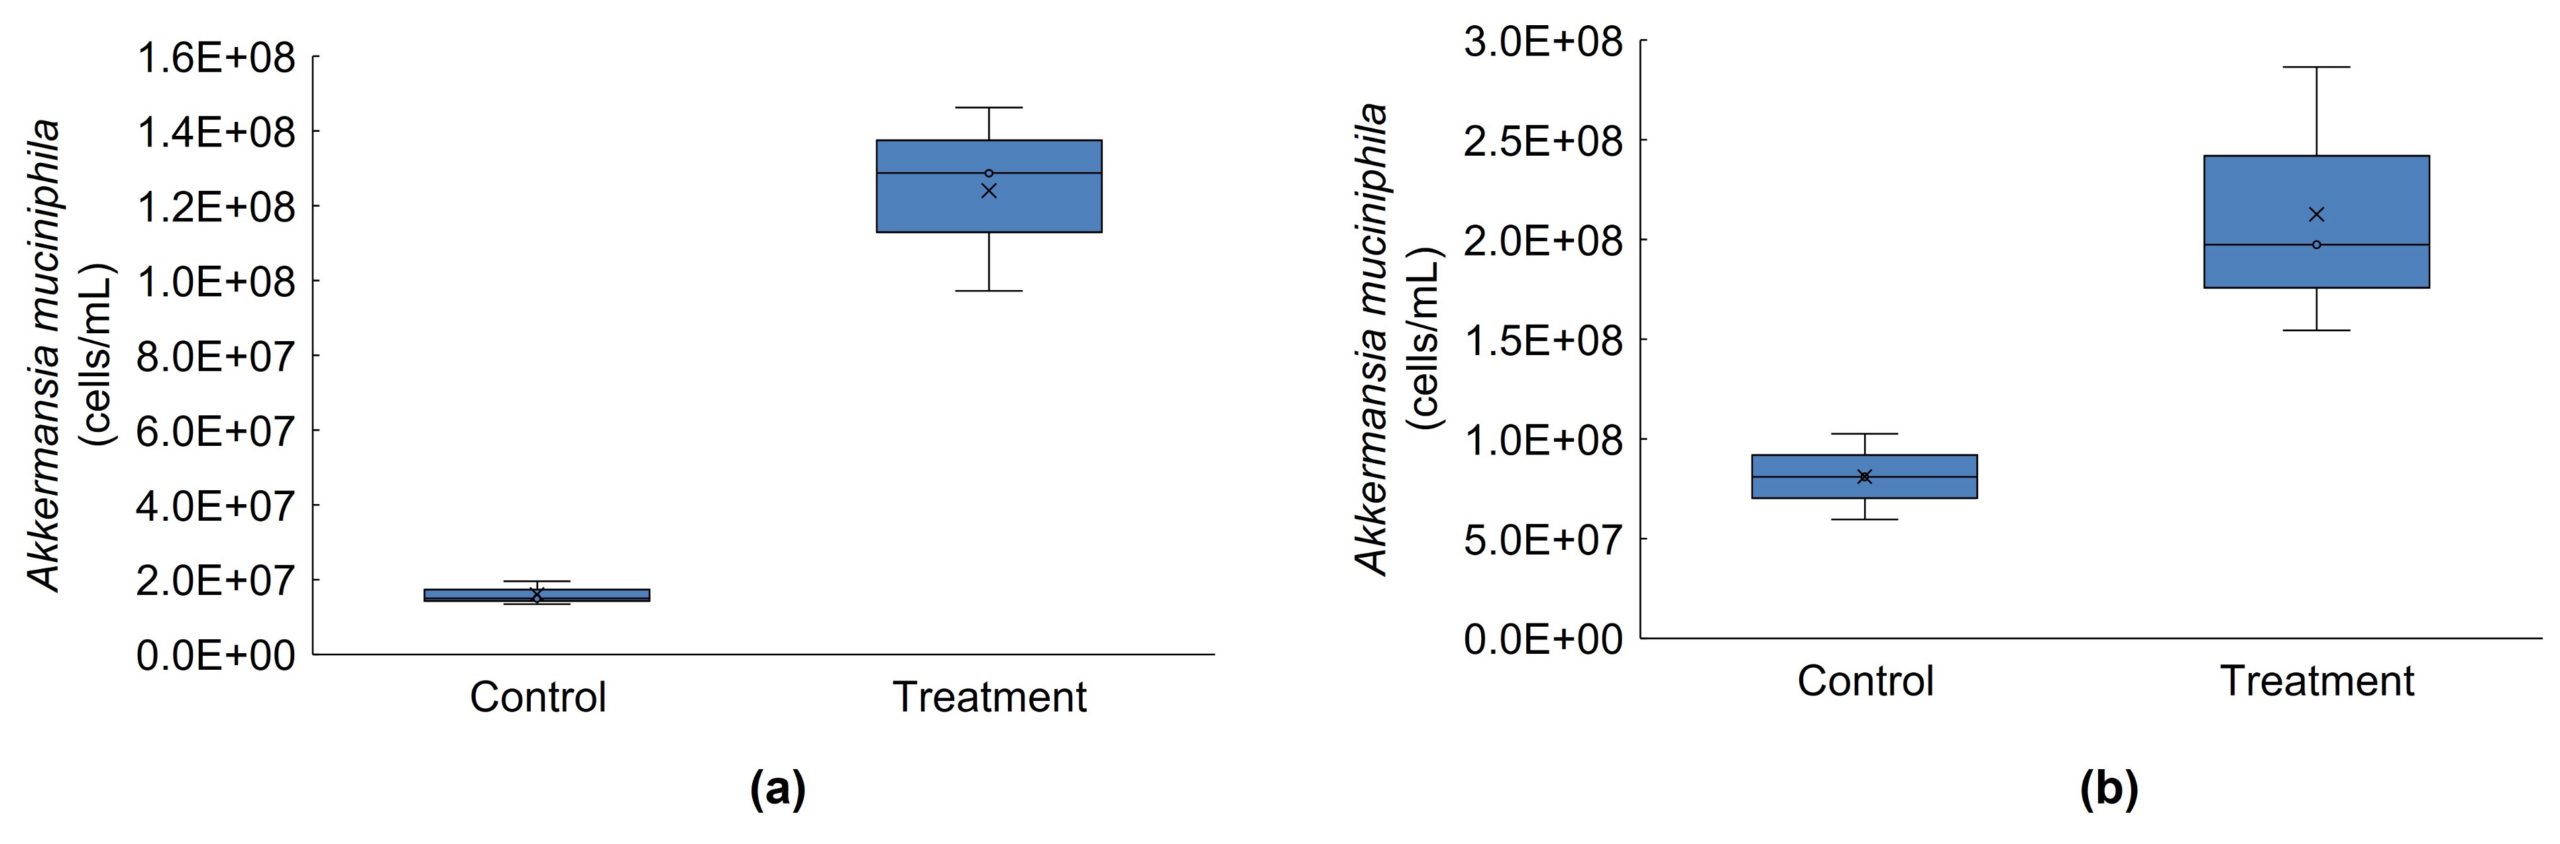
Boxplots showing absolute abundances (cells/mL) for Akkermansia muciniphila for donor A (A) and donor C (B) in the distal colon at the end of the control and treatment periods of the Triple-L-SHIME® experiment (levels of this taxon were below the limit of quantification for donor B). No test products were administered to the colon reactors during the control period, tributyrin was administered daily to the colon reactors during the three-week treatment period. Samples were collected at the end of the control and treatment periods from each reactor representing donor A and donor C (n = 3 per donor) and subjected to metagenomics analysis. ‘x’ in the boxplot indicates the average value. SHIME®, Simulator of the Human Intestinal Microbial Environment.
Coupling the colonic fermentation fluids to a Caco-2/THP1 co-culture showed that treated reactors protected the epithelial barrier against LPS-induced disruption, raised the anti-inflammatory cytokine IL-10, and lowered TNF-α in the proximal colon condition.
The wider cytokine picture was not uniformly anti-inflammatory, and it is worth saying so: IL-1β also rose in the proximal colon, and IL-6 was inconsistent between donors. Barrier protection is the robust signal here. The immune readouts point in a promising direction without settling it, which is exactly the kind of question a patient-derived model is better placed to answer.
What this means for gut health researchers
First, a negative result at week one is not a negative result. If your study design is shorter than the biological process you are monitoring, you are not able to measure the true impact of your product.
Second, kinetics are data in their own right. Knowing that an effect emerges at week three rather than day three tells you something usable about dosing regimen, expected time-to-effect, and how long a clinical study needs to run to have a chance of detecting anything.
Third, location matters. An effect that is significant in the distal colon and absent in the proximal one is not noise to be averaged out. It is the shape of the response.
Whose gut are you testing in?
This study used microbiota from three healthy adult donors on a Western diet. For a first mechanistic characterization, that is the right choice as it isolates the ingredient effect from disease-driven variability.
However, this is also a limitation worth naming, particularly for a clinical nutrition audience. The patients who stand to benefit most from a butyrate-delivering postbiotic are frequently the ones whose microbiome is least able to produce butyrate itself: people with inflammatory bowel disease, with metabolic disease, recovering from antibiotic exposure. A healthy donor panel cannot tell you how a dysbiotic community will respond.
That panel can, however, be swapped out. At ProDigest we maintain a registered human biobank (BB220010, operating under Belgian regulatory requirements and available to clients since 2021), which means the same long-term models can be inoculated with microbiota from specific patient groups rather than average healthy donors (e.g. inflammatory bowel disease, obesity, diabetes, antibiotic-disrupted communities, and specific age groups from infants to elderly). If your product is intended for a patient population, this is the population your model should be running on.
Interested in reading the full paper? Read more here. Curious how we can support your product development? Let’s talk!